
GENOM 2005: Advanced Microarray Analysis Software
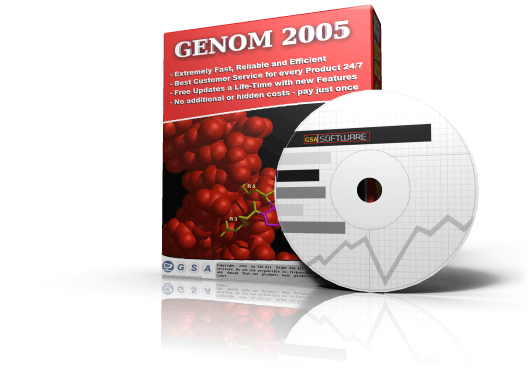
GENOM 2005 is a comprehensive, feature-rich bioinformatics platform designed for the advanced analysis of microarray and array-based differential gene expression experiments. Specially engineered to support high-density arrays-such as those from Affymetrix-this user-friendly software bridges the gap between raw data processing and high-impact biological insights. By integrating multi-method analytical pipelines, automated pathway mapping, predictive functional genomics, and direct literature cross-referencing, GENOM 2005 accelerates discovery workflows for molecular biologists, geneticists, and clinical researchers.
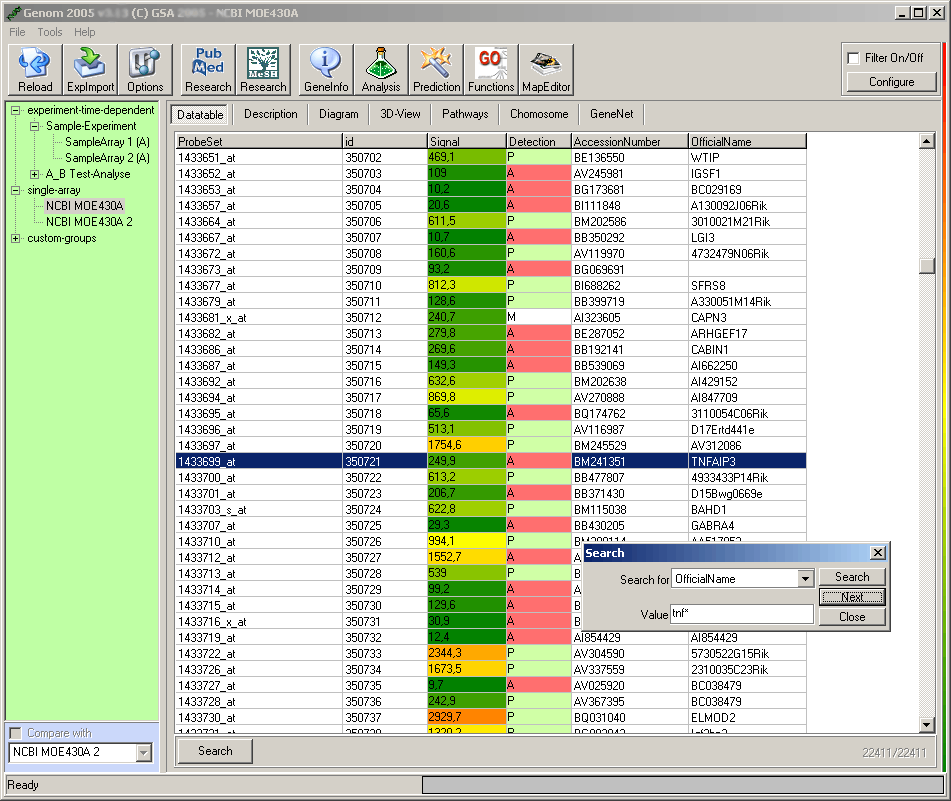
Dynamic Expression Profiling
Visualize multi-signal array data instantly with customizable, high-contrast color-coding designed for rapid data auditing. Each transcript row is fully mapped to its corresponding official gene symbol and standard database accession number.
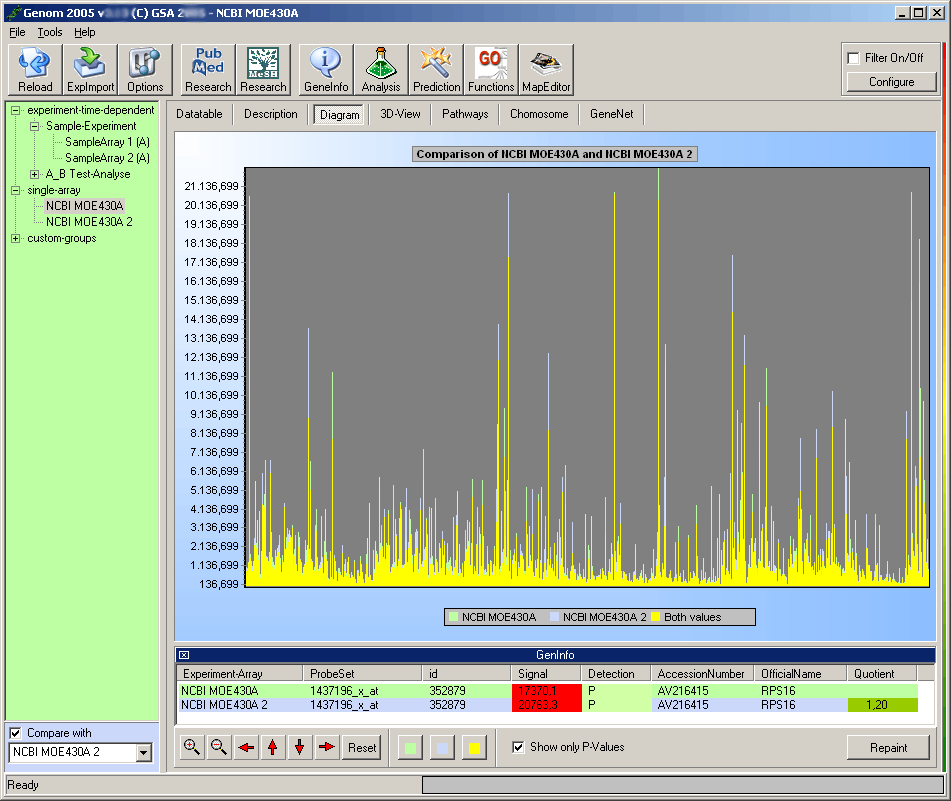
Gene Expression Graph
Quickly see which array data has the most peaks. Zoom in/out to easily find the interesting spots on your array.
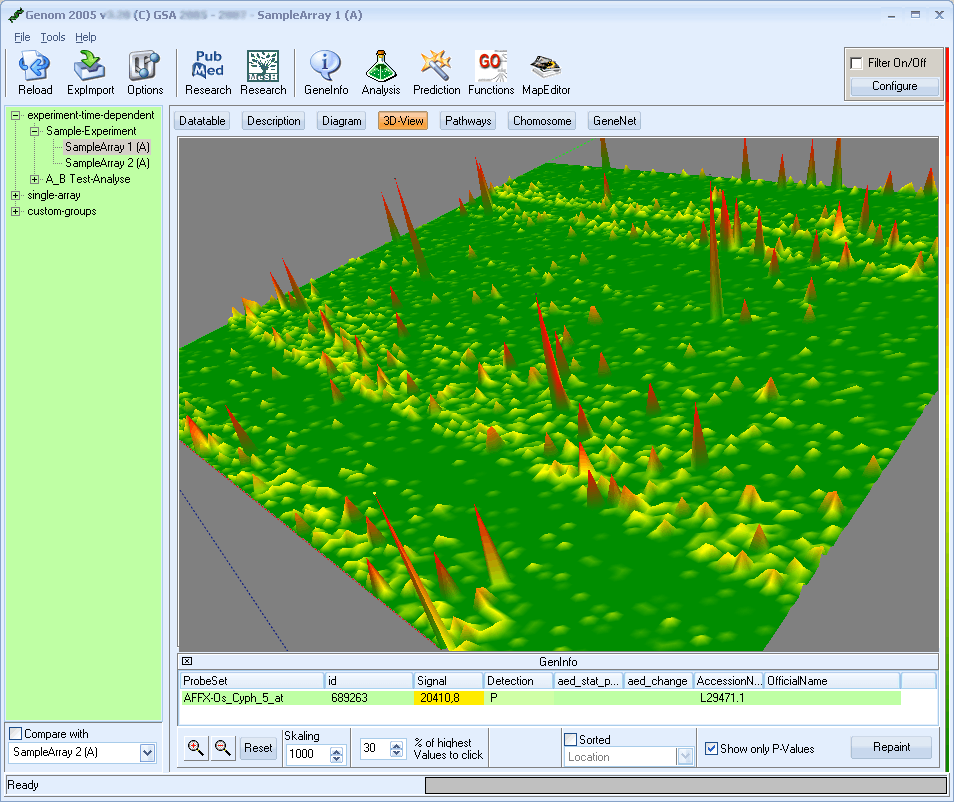
Interactive 3D Microarray Topology
Render probe intensities in an immersive 3D spatial view. Effortlessly compare multiple arrays side-by-side to pinpoint statistically significant outlier probesets. Sort data dynamically by biological function or physical chromosomal locus.
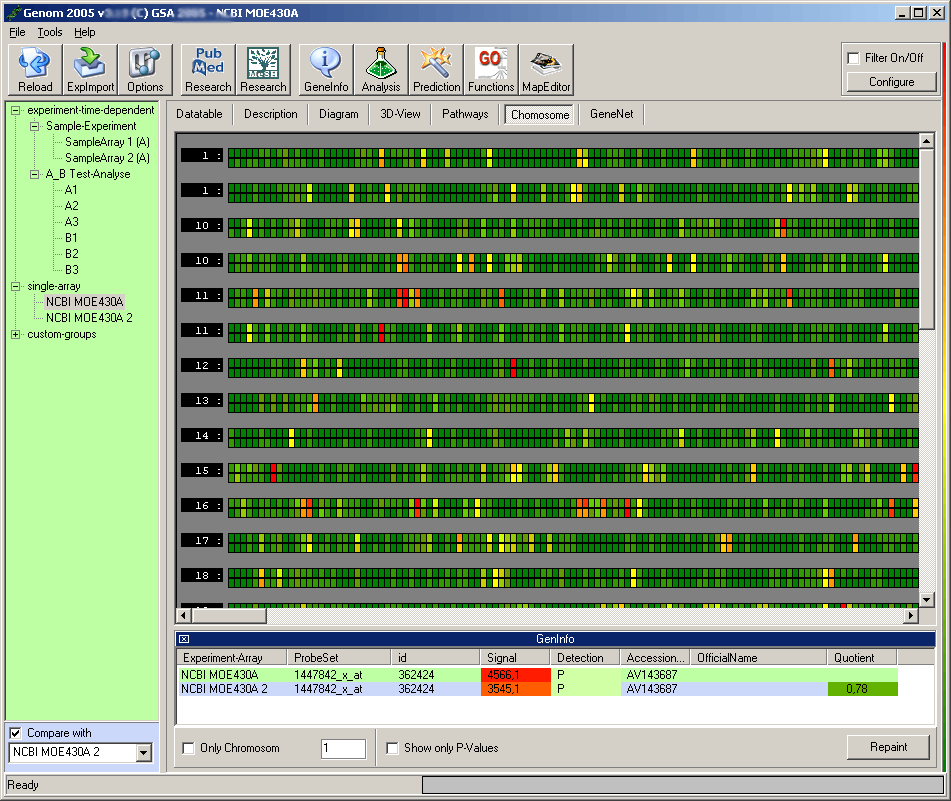
Chromosomal Mapping Coordinates
Map and display transcript profiles sequentially based on their physical coordinate distribution across chromosomes, exposing regional genetic up- or down-regulations.
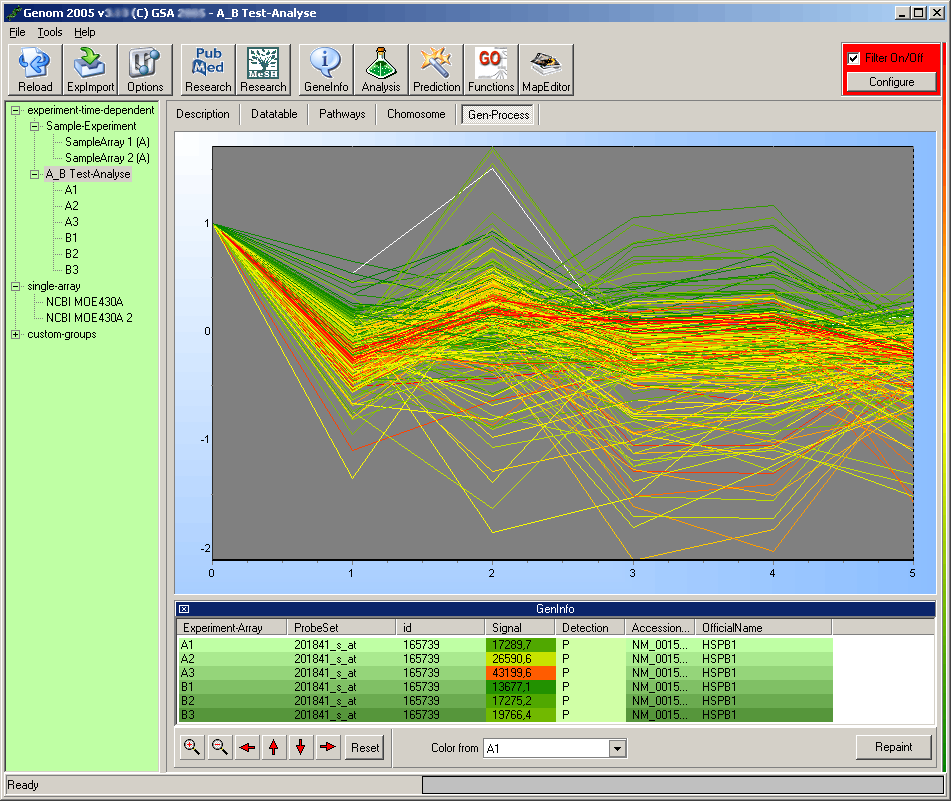
Time-Course Expression Trajectories
Trace specific probeset kinetics across sequential time points or conditions. Linear trend-graphs isolate co-regulated gene groups across complex experimental phases.
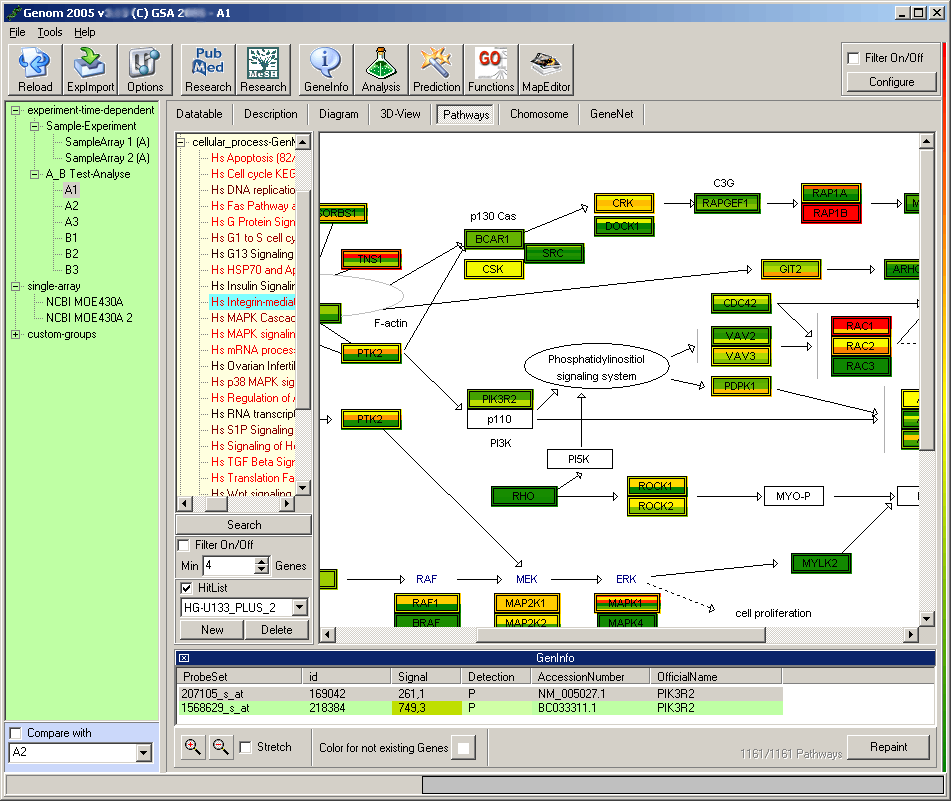
Direct Pathway Integration
Instantly overlay your loaded transcriptomic profiles onto standardized biological pathway maps. This native cross-linking allows you to observe systemic metabolic or signaling adjustments at a glance.
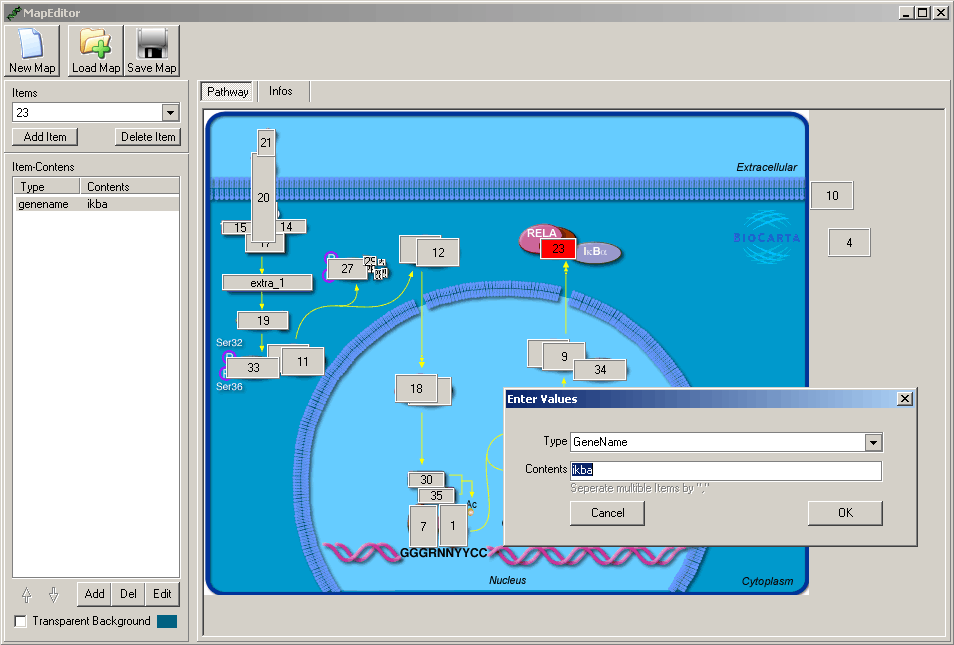
Precision Pathway Architect
Utilize the integrated vector map editor to construct original, bespoke molecular pathways from scratch, or quickly edit existing public networks to match your unique laboratory hypotheses.
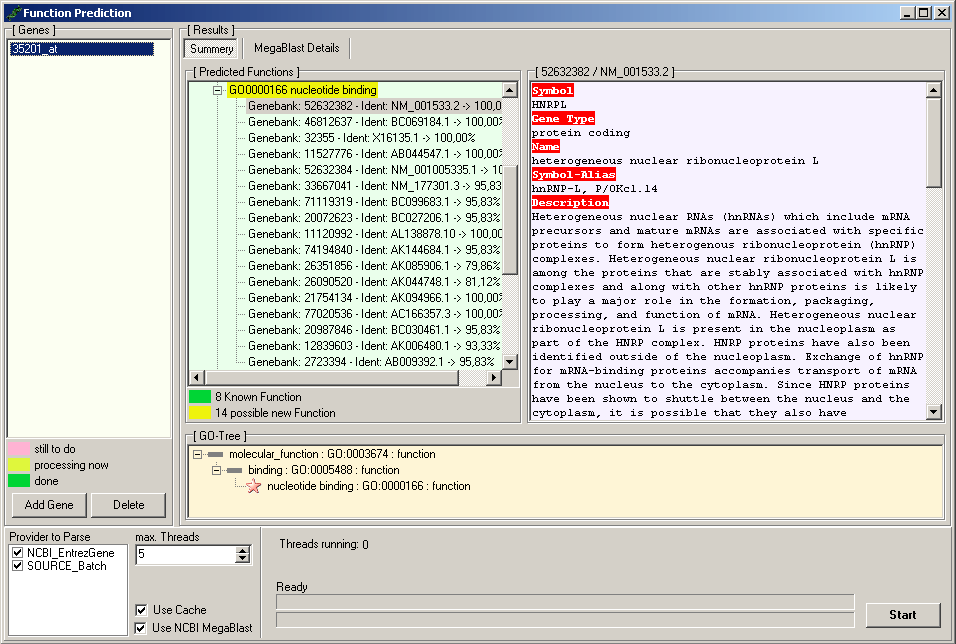
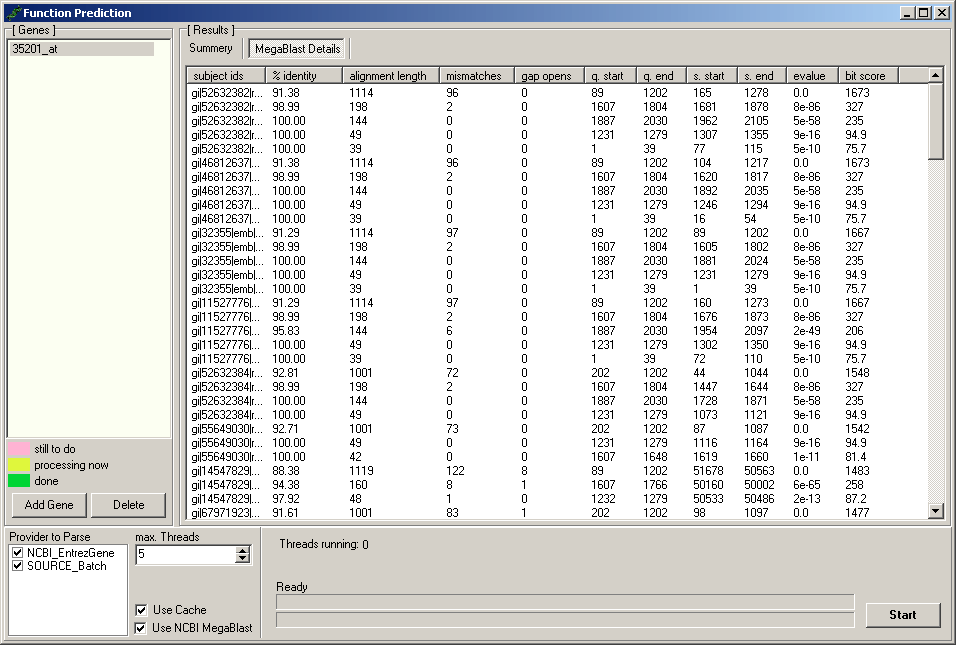
Automated BLAST Functional Prediction
Uncharacterized sequences and Expressed Sequence Tags (ESTs) no longer limit your discovery scope. Submit unannotated transcripts or custom FASTA sequences to an online BLAST query directly through the platform to predict novel gene functions and structural identities.
Function Prediction Details
Details about the function prediction.
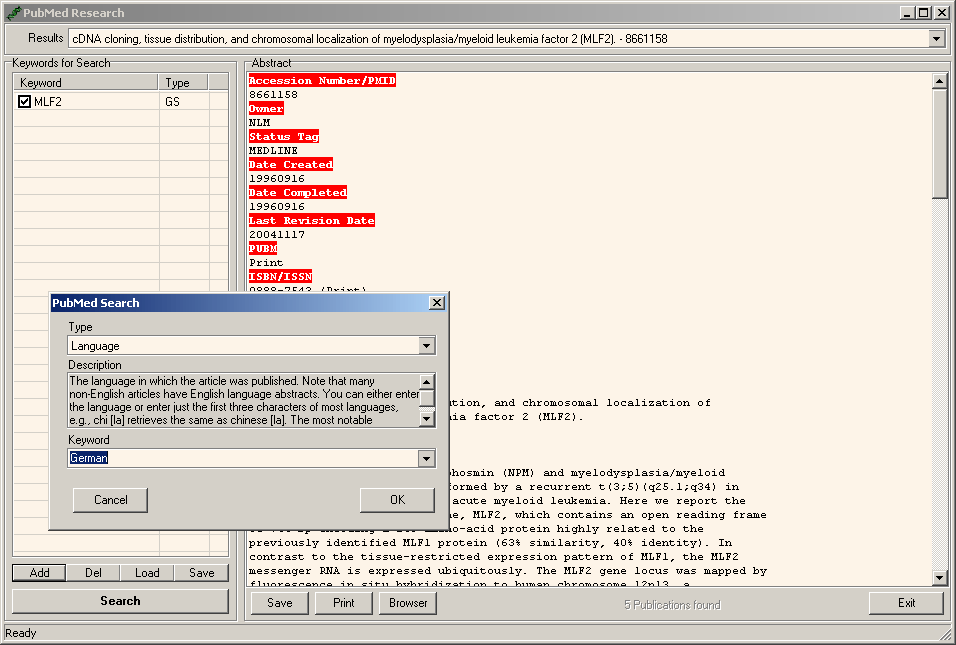
Integrated PubMed Literature Mining
Query the global PubMed archive directly within the software workspace. Extract and return contextually relevant medical and scientific literature based on filtered genes or target keywords.
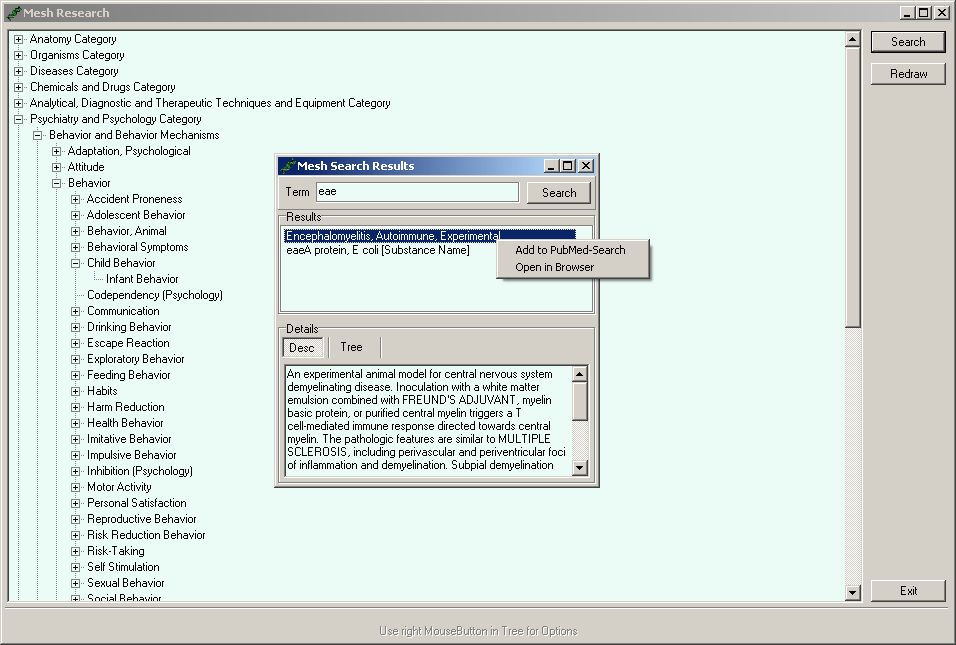
MeSH Semantics Optimization
Leverage integrated Medical Subject Headings (MeSH) hierarchies to construct precise, high-accuracy query strings for automated literature sourcing.
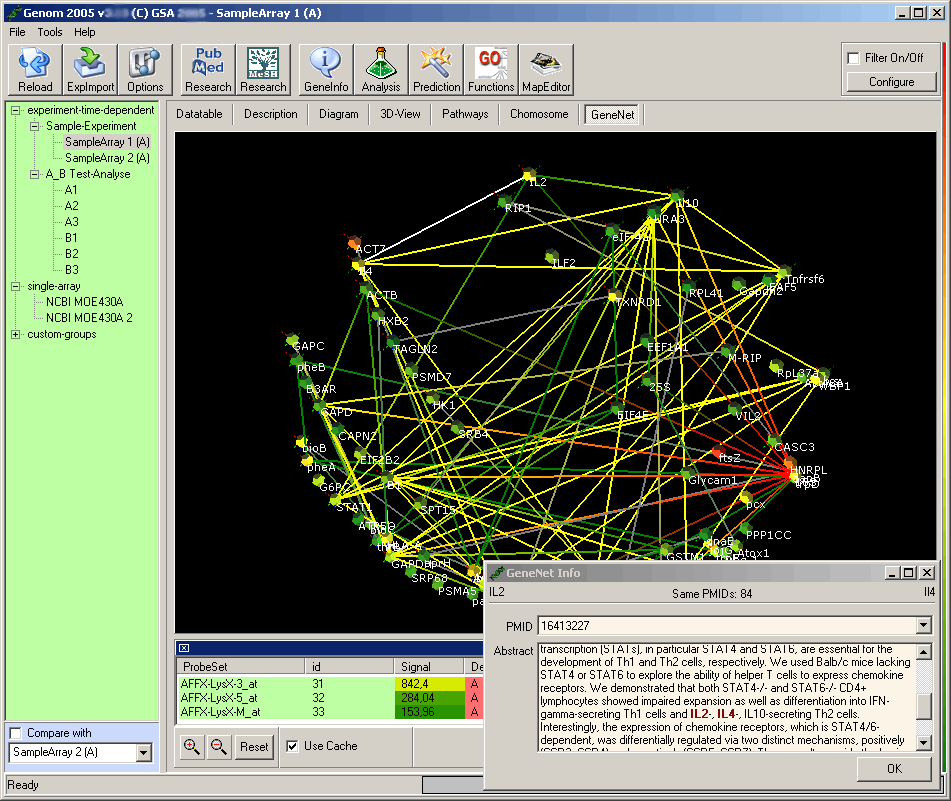
Dynamic Gene Interaction Networks
Generate relationship diagrams based on co-occurrence and scientific correlations within fetched PubMed abstracts, visualizing complex gene-to-gene interactome networks.
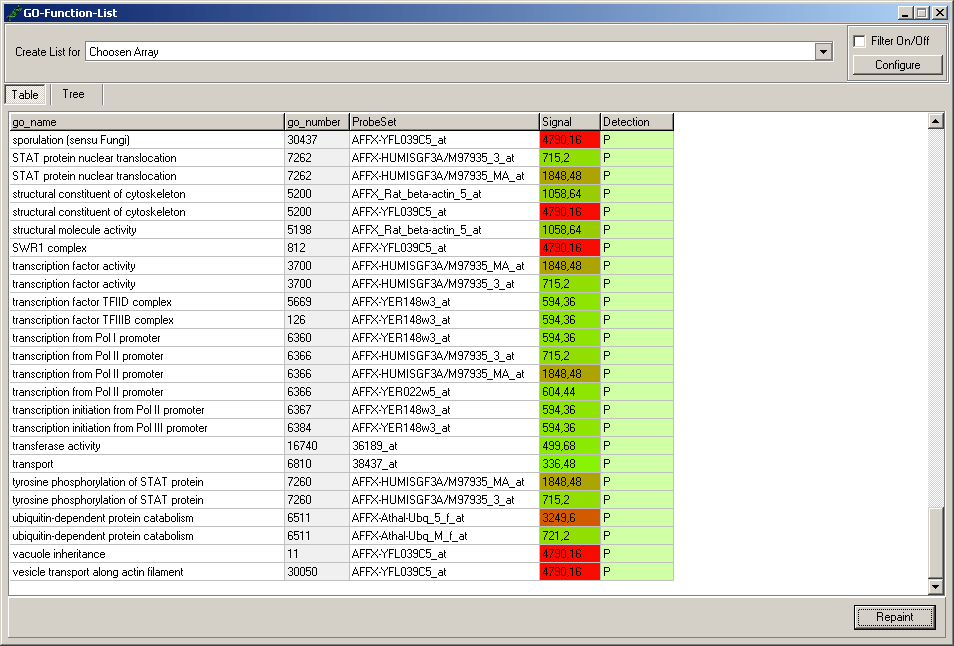
Gene functions for Microarray
This algorithm presents the data in a table with all the gene functions from the genes you previously filtered out. This can be done for the whole array.
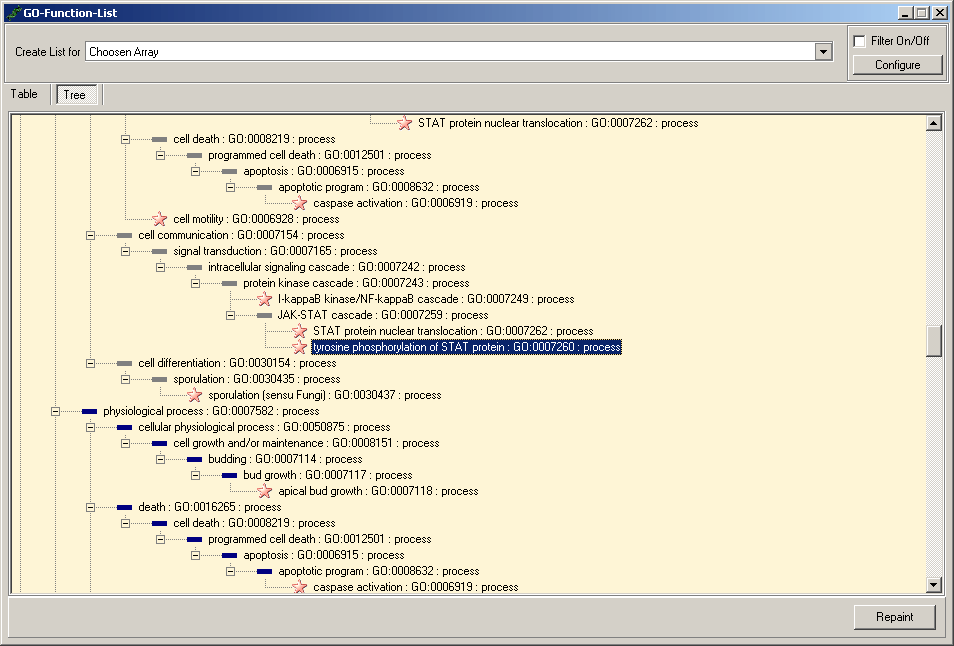
GeneOntology (GO) Core Mapping
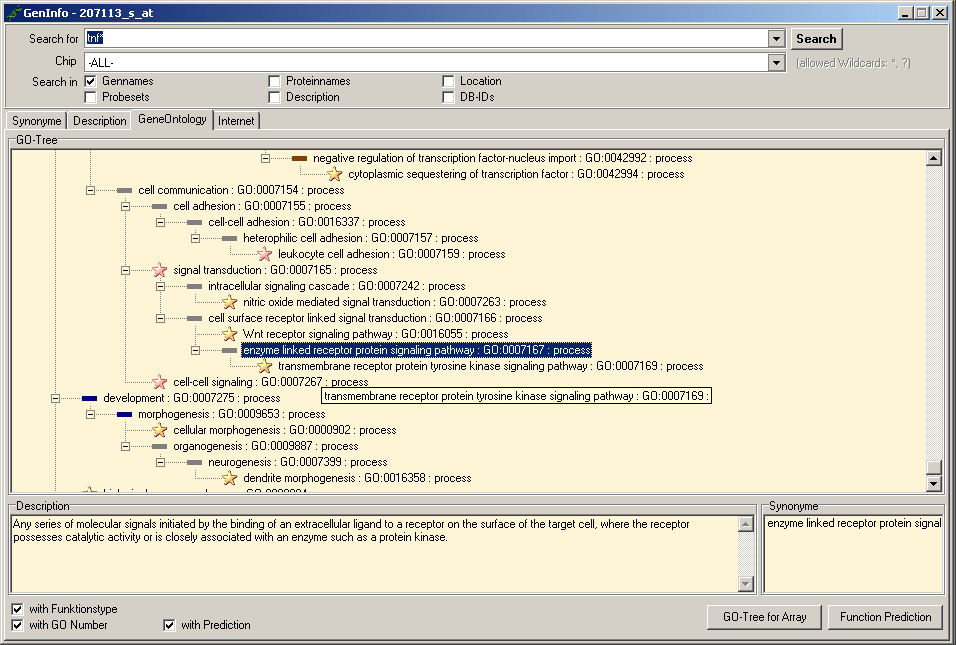
Categorize and review filtered datasets using structured GeneOntology terminology. Probeset distributions can be analyzed across interactive GO trees to evaluate cellular components, molecular functions, or overall biological processes.
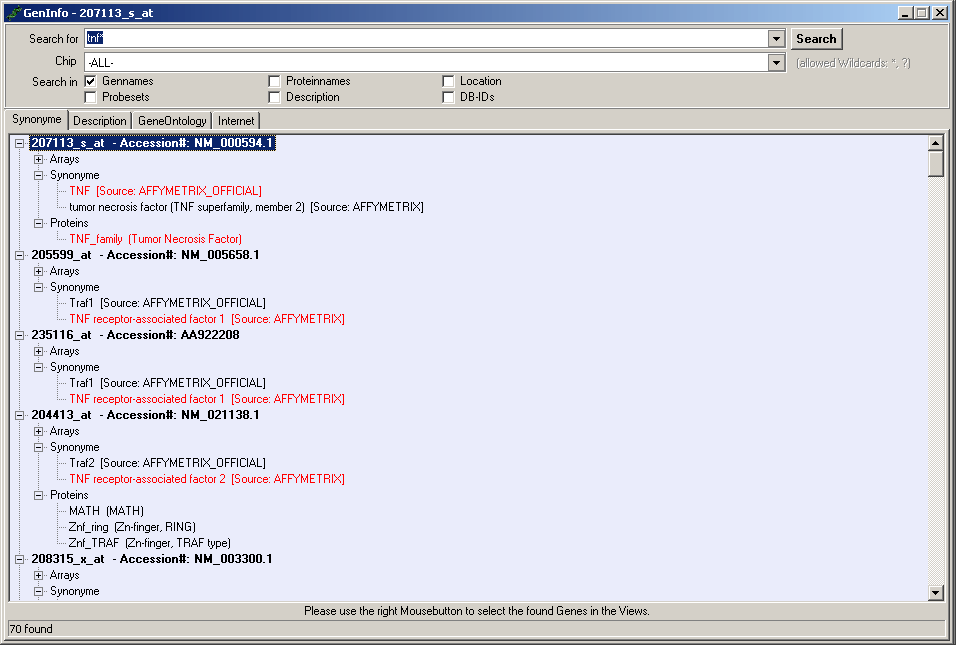
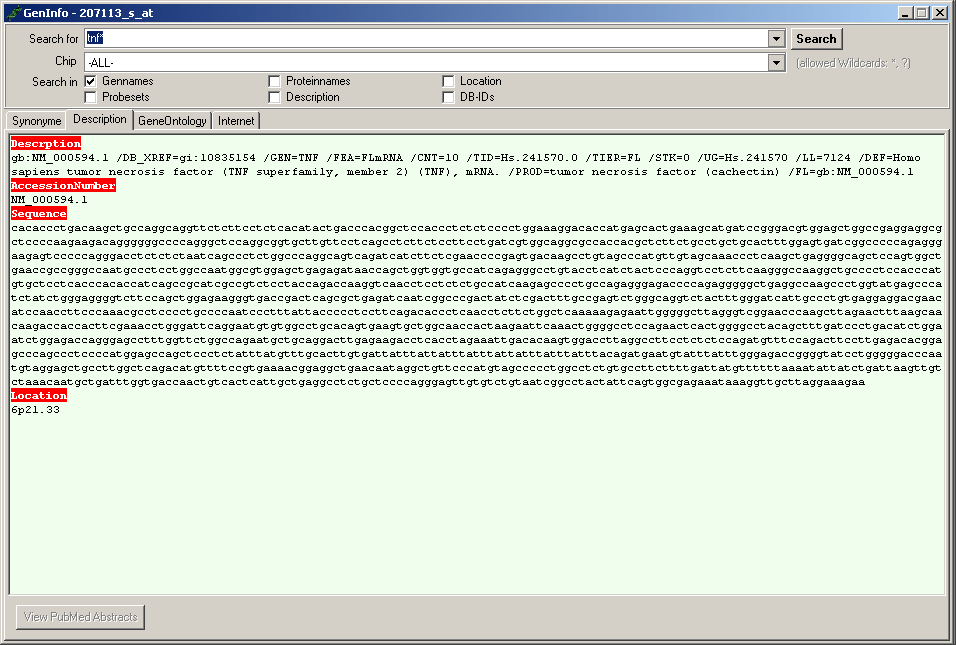
Probeset Information
The gene information dialog. Here you get more detailed information from the searched query like sequence, description and more.
Instant Query Hyperlinking
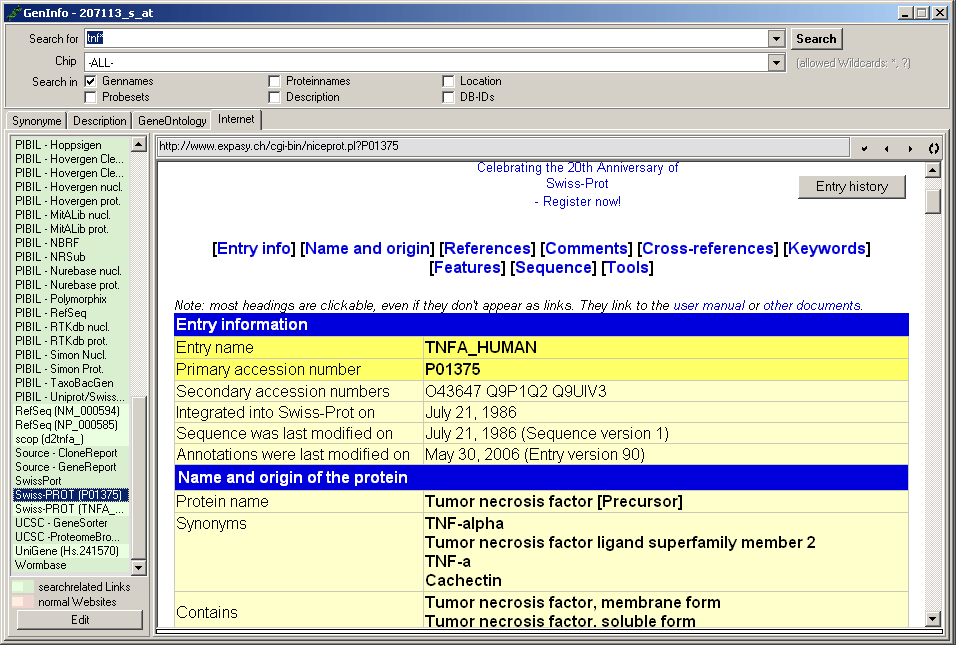
Access external genomic repositories with zero data friction. Simply click any reference link inside a probeset card to launch the exact online target page without filling out web lookup forms manually.
Functions for Probeset
Another GeneOntology graph of the gene functions from the gene.
Deep In-Silico Research & Database Cross-Linking
GENOM 2005 integrates external databases directly into its interface, eliminating the need to manually toggle between web browsers and external search forms.
Matrix Hierarchical Clustering
Execute complex clustering algorithms with minimal configuration. The software automatically groups similar gene expression profiles together, generating clear, interpretative heatmaps and dendrograms.
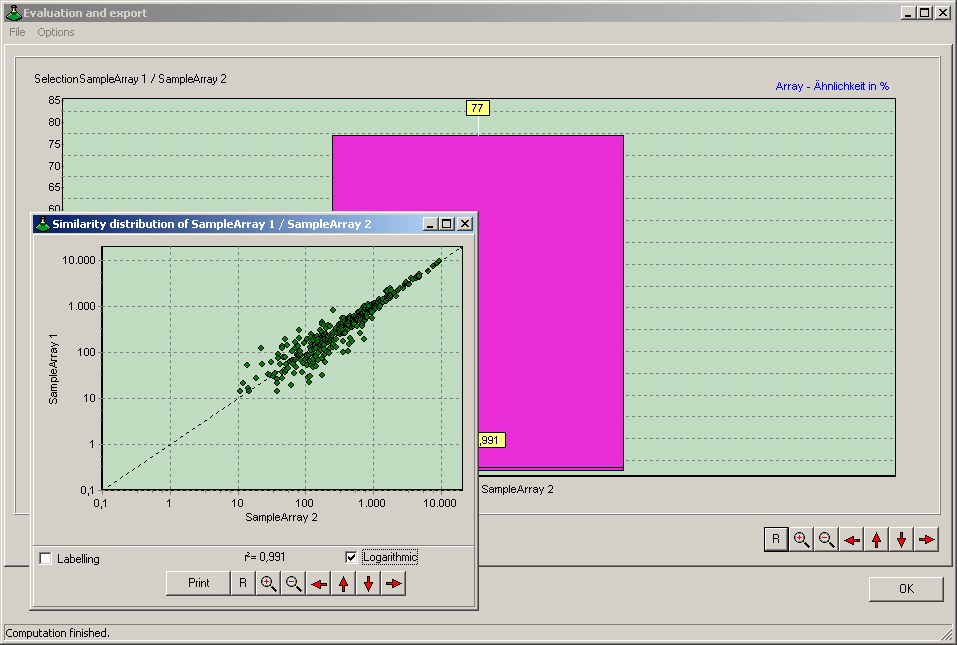
Interactive Scatterplots
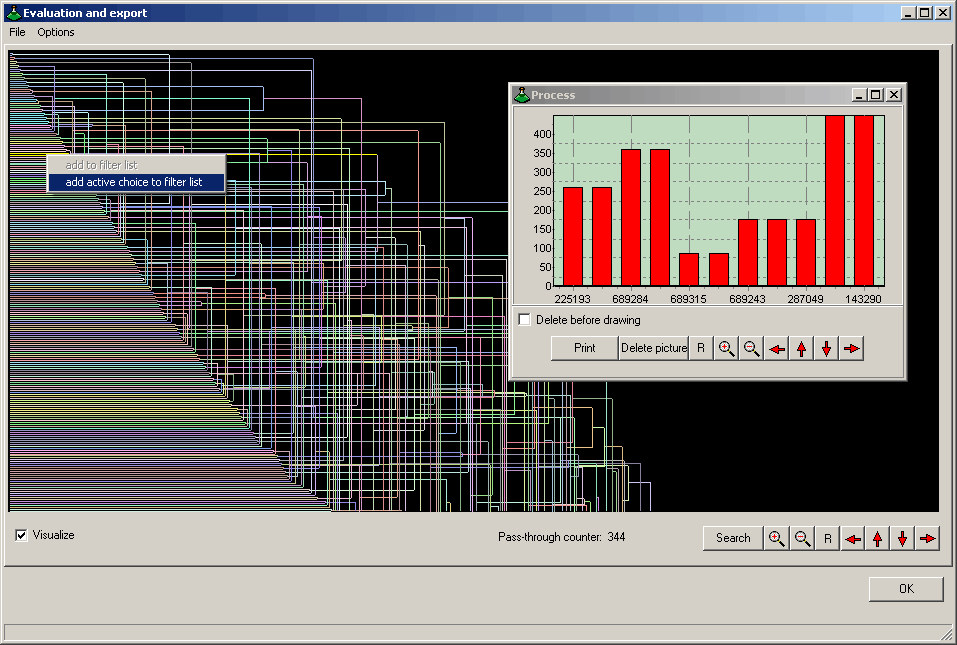
Evaluate global transcript variances, assess technical or biological replicate uniformity, and track comparative expression deviations using dynamic, multi-variable scatterplot graphs.